
CASE STUDY
Digital card board for an automotive supplier
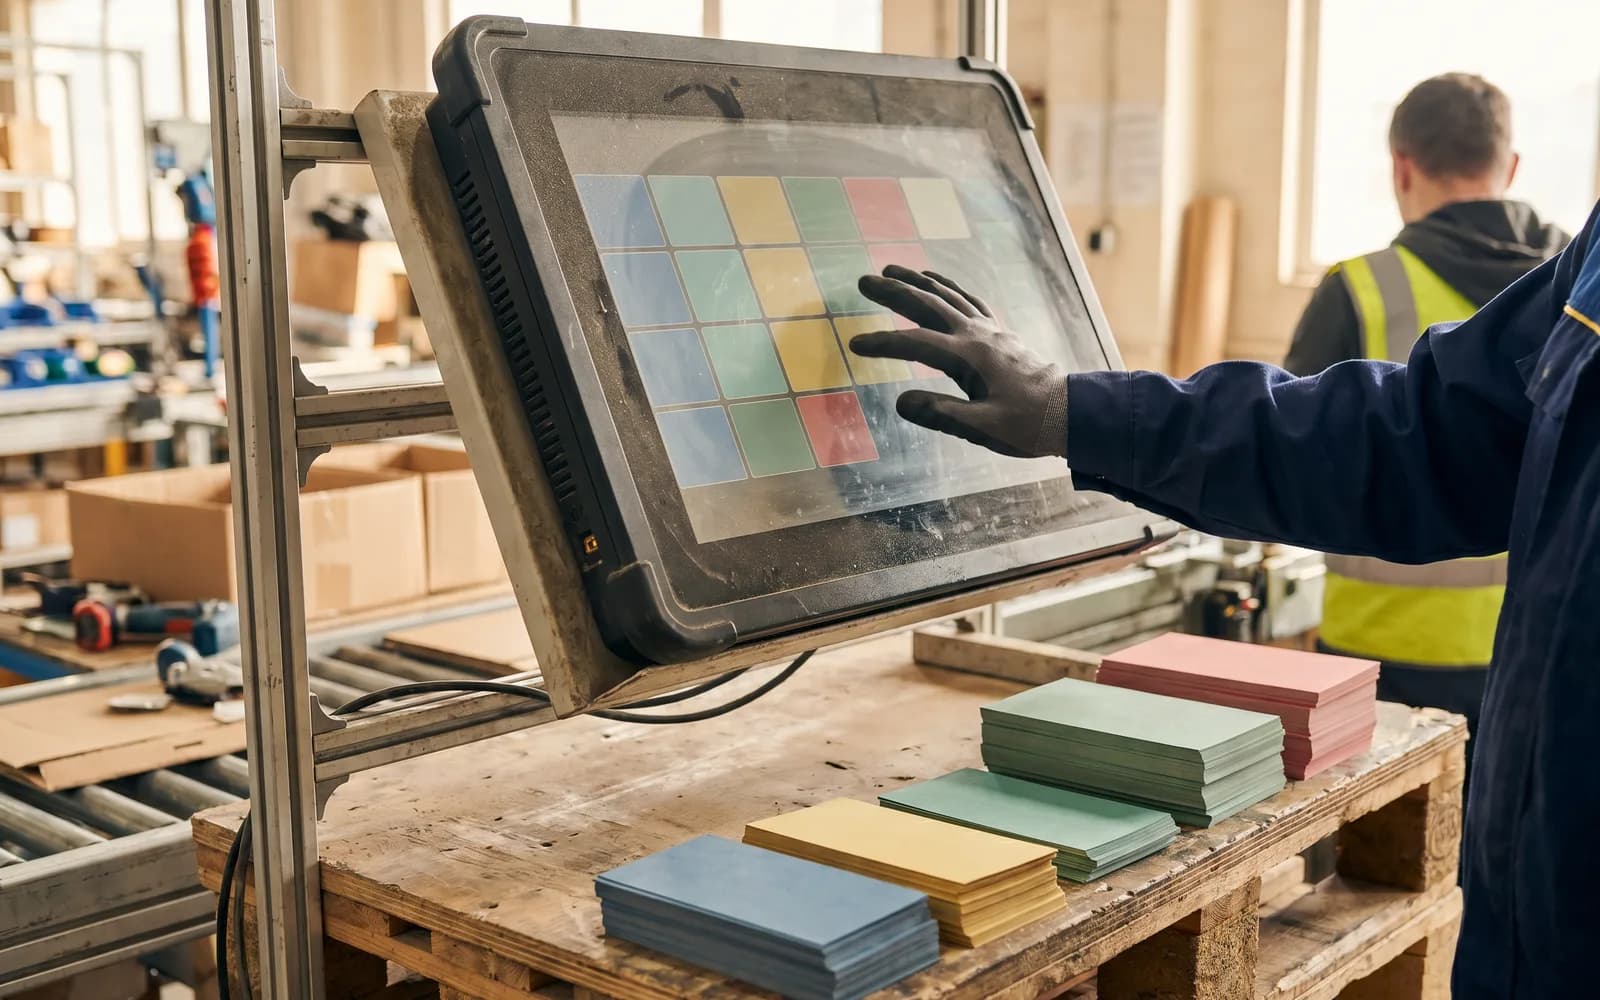
Colour-coded paper travelers mirrored digitally rather than replaced: the same geometry on large touch monitors — and production data lands in the ERP in real time instead of only at the end of the shift.
INDUSTRY
Automotive supplier (Tier 2)
SERVICES
Workflow Integration, Custom Web App, Legacy Bridge
TIMEFRAME
2011 · 6 months
/01
The situation
Physical travelers accompanied every component through the assembly lines, but the central ERP was only updated at the end of each shift via a manual batch run. The result was regular data lag, mismatched quantities and inaccurate stock levels. Management pushed for immediate full digitalization with rugged tablets at every single assembly station.
The workers had used heavy, colour-coded paper cards for over two decades. Shift leaders and operators read production status and urgent orders from fifteen metres away purely from the arrangement and colour of the cards on the staging racks. Small, greasy dropdown lists on tablets would have destroyed this ingrained visual mental model, cut output and triggered massive resistance.
/02
Our approach
Instead of imposing an abstract, table-based software grid, we designed a custom web application — the “Digital Card Board”. The interface adopted the geometry, colour world and typography of the original paper cards one to one. Large industrial touch monitors were mounted directly on the existing staging racks; operators moved the digital cards with a simple swipe gesture that precisely mirrored their familiar hand movement.
Technically, as a two-person team, we set up a lean, responsive frontend for the touch hardware. It talked to an on-premise middleware we developed that worked as a non-invasive terminal emulator: it captured the gestures on the shop floor and translated them in the background into keyboard macros that fed the data directly into the existing IBM AS/400 ERP — without touching the legacy system.
/03
The outcome
Data lag in the ERP dropped from four to eight hours of backlog to near real time — under two seconds. Stock levels and quantities matched the actual situation on the line again.
Because the interface respected the operators' historical mental model, acceptance was high from day one; onboarding took less than thirty minutes per shift group. The familiar visual status cues were fully preserved.
YOUR PROJECT